Case study · Concept · Sports analytics
SCOUT
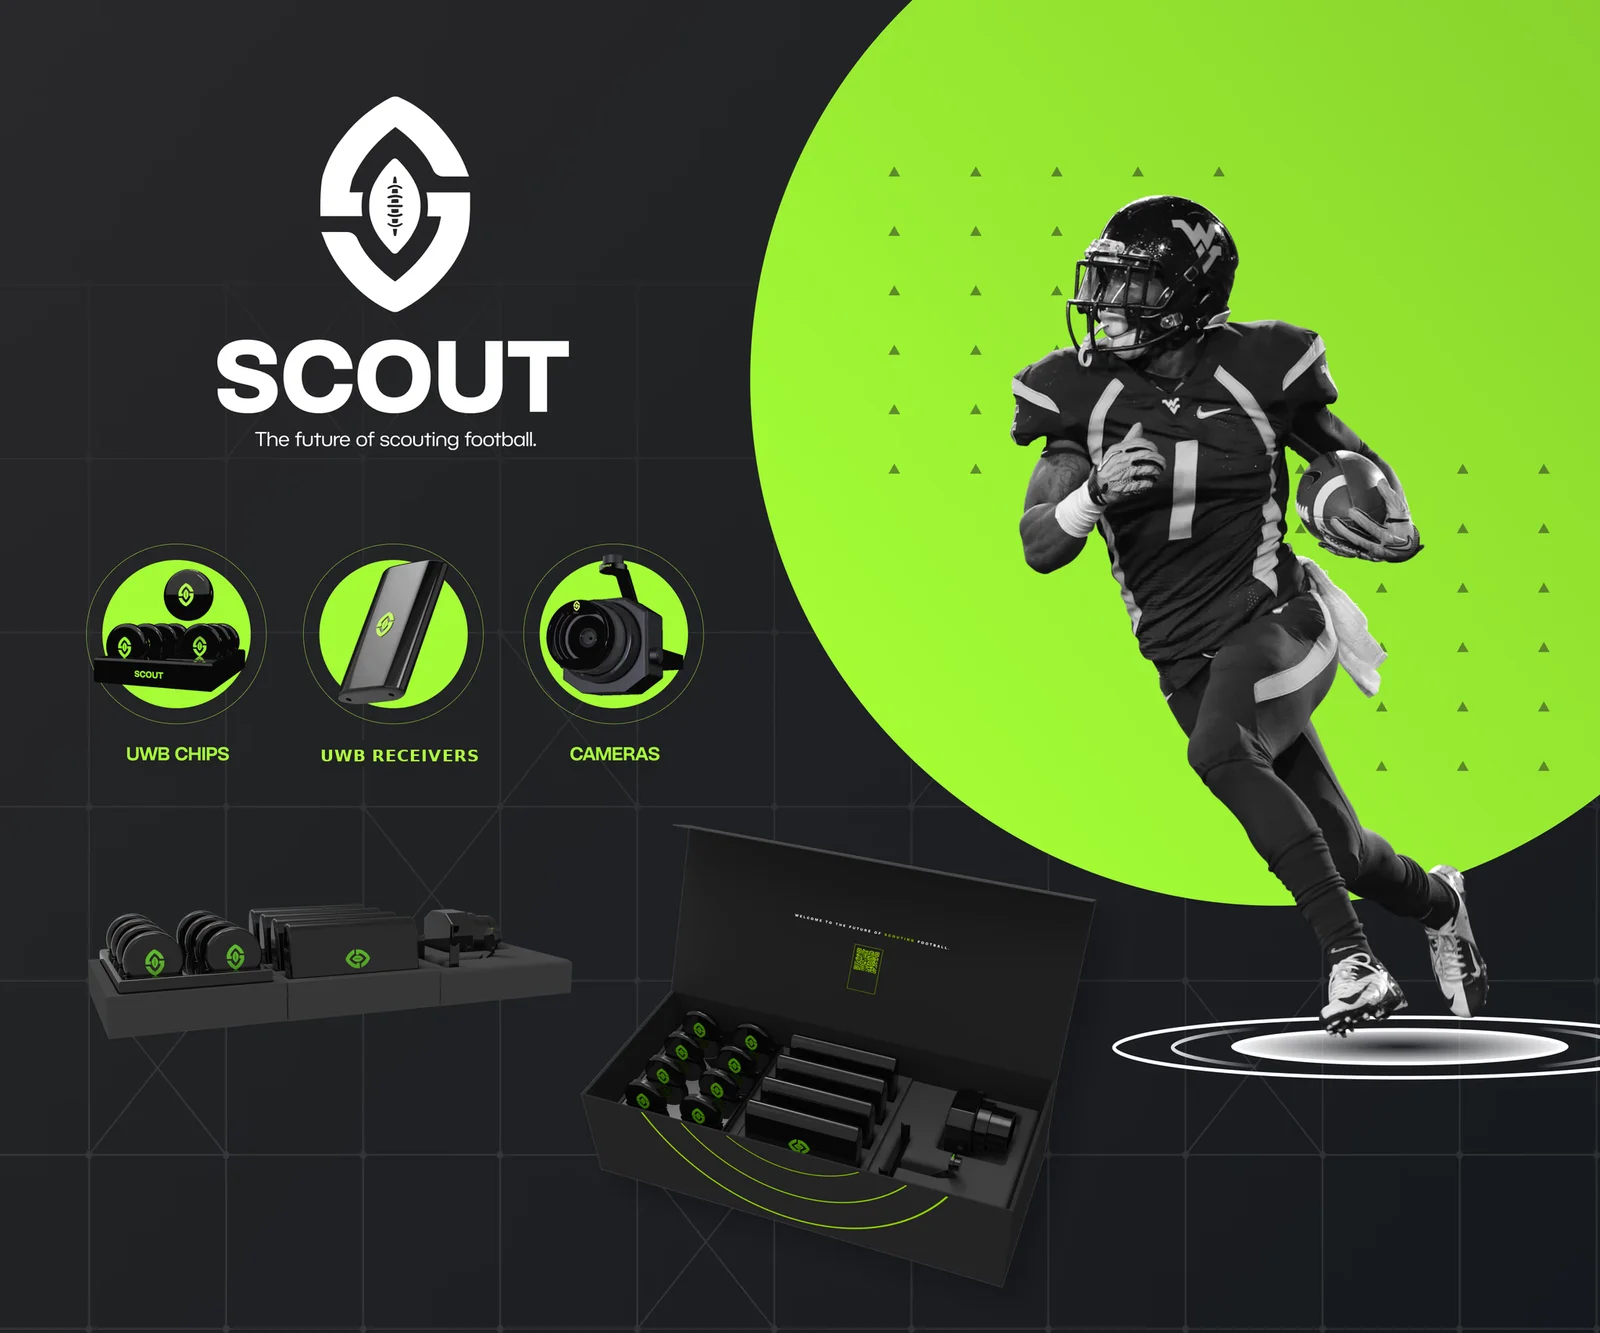
A player-tracking system for NCAA college football — cameras, UWB chips, and software that put everything an NFL scout needs about a prospect in one place.
Concept projectGold — IDA Design Awards 2024Team project — UX for the Modern Era, Savannah College of Art and Design. No affiliation with the NFL or NCAA.
- Role
- Product Designer · end-to-end
- Program
- SCAD · UX for the Modern Era
- Scope
- Research · Hardware concept · Software UI · Testing
- Tools
- Figma · Raspberry Pi · Python
Problem
Three hundred prospects. Five disconnected tools.
NFL scouts evaluate the talent pipeline for the entire league — and the job is brutal. A typical scout tracks around 300 college players at a time; in a 2021 ESPN interview, one veteran estimated he'd spent a fifth of his life on the road doing it.
The data those miles produce ends up scattered: tracking numbers in one place, athletic testing in another, medical reports, interview notes, and film grades somewhere else again. Organizing it is hard. Comparing prospects across it is nearly impossible — and comparison is the whole job.
Research & data analysis
The NFL already proved the technology
The league has tracked its own players for a decade. Since partnering with Zebra Technologies in 2014, every NFL player carries RFID tags in their shoulder pads, read by ultra-wideband receivers ringing the stadium — producing location, speed, and acceleration for every play, and 200+ derived metrics behind the league's Next Gen Stats.
- 2014 NFL × Zebra tracking partnership begins
- 2 tags nickel-sized, in every player's shoulder pads
- 20–30 UWB receivers installed per stadium
- 200+ metrics derived per play for Next Gen Stats
The opportunity
All of that exists after a player is drafted. The college prospects scouts actually evaluate produce no equivalent unified data — the decision with the most riding on it is made with the least infrastructure behind it.
The user isn't the customer
SCOUT only works if two different audiences win: the scout who uses it daily, and the college program that buys and installs it. Designing for one without the other kills the product.
Target user
NFL scouts
- Manage hundreds of prospects without drowning in tools
- Compare college data against NFL player analytics to project how a prospect transitions to the pros
- Less time re-assembling data, more time evaluating it
Target buyer
D1 FBS college programs
- Tracking data for their own players — practice and game
- Team development insights from the same infrastructure
- Seamless integration with software their staff already runs
Define
A year in Michael's life
Michael Dugar
Michael is passionate about finding talent and building teams that work — he understands that a good pick is synergy between players, not just athletic and medical numbers in isolation. He's also a father with a terrible work-life balance: bowl season means holidays on the road, and the outdated, slow tools he's stuck with stretch every evaluation longer than it needs to be. Scouts like Michael don't burn out from the work. They burn out from the overhead around it.
Pain points
- Work/life balance destroyed by travel
- Holidays spent scouting bowl games
- Outdated, slow technology
Needs
- Real-time athletic data he can trust
- Tools that gauge ability, not just record it
- More of the year at home
Journey map — Michael's emotional curve across a scouting year
- 01Preseason prepOptimistic — a fresh board of prospects and a plan for the fall.
- 02Fall travelFatigue sets in. Weeks on the road, hundreds of miles between campuses.
- 03Film & notesFrustration. Data lives in five tools and none of them talk to each other.
- 04Holidays awayThe low point — bowl season means scouting through the holidays, away from family.
- 05The CombineInformation overload: a firehose of testing data with no way to compare it to his own notes.
- 06Draft dayThe payoff — but every pick rests on evaluations assembled from scattered fragments.
How might we
…combine player tracking data with machine learning into an analytical sports AI that aids player and team development — and gives scouts their year back?
Develop
One system, three parts
SCOUT deliberately mirrors the architecture the NFL already trusts — cameras and UWB chips feeding one software home — because scouts shouldn't have to believe in new physics, just better plumbing.
01
Cameras
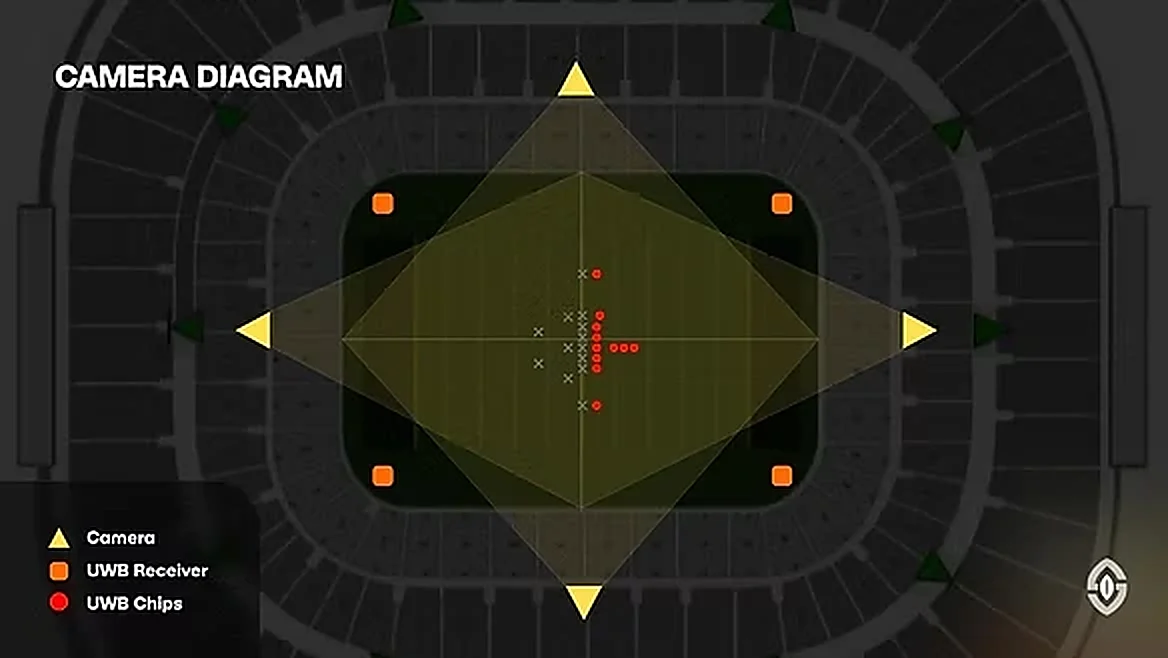
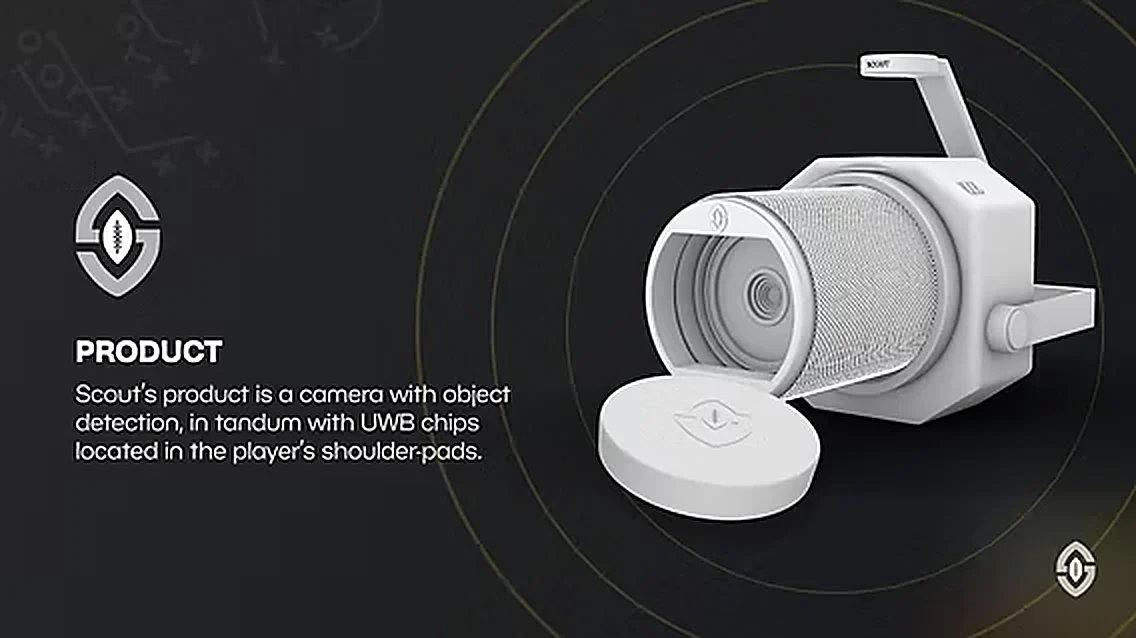
Object-detection cameras positioned around the field. The prototype was built on a Raspberry Pi with Python — a working proof, not a rendering.
02
UWB chips
Ultra-wideband chips in the players' shoulder pads, read by receivers around the stadium — the same placement and approach the NFL's own tracking uses.
03
Software
A desktop home for athletic, medical, and tracking data — built to analyze, compare, and manage prospective talent instead of just storing it.
The software
Dense data, made comparable
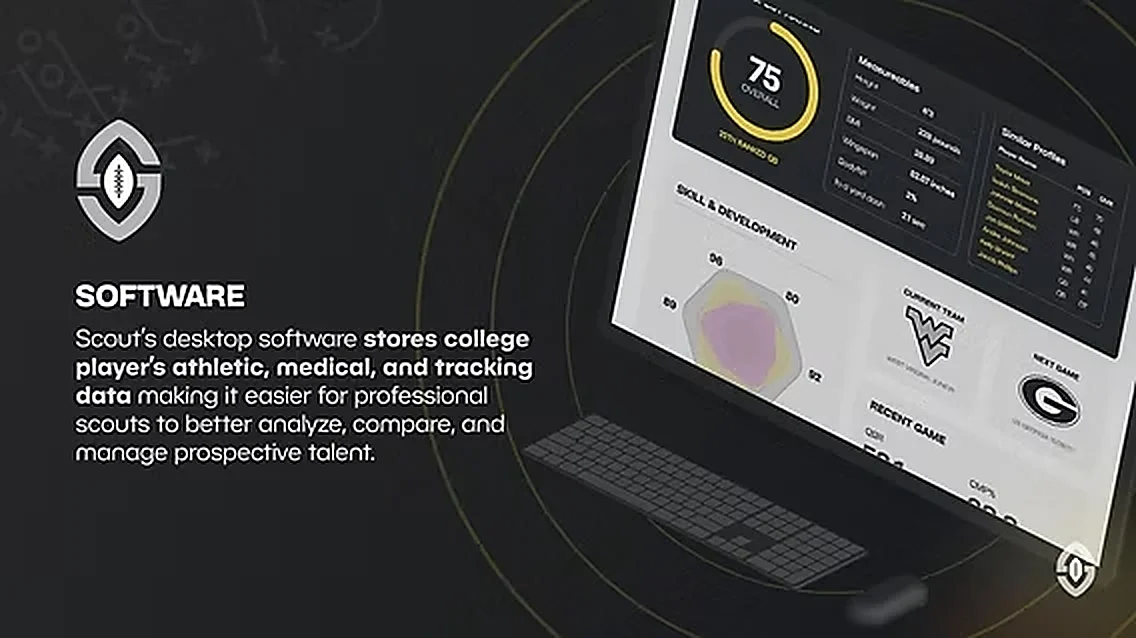
- The grade is a doorway, not a verdict. The 75 overall opens the profile, but every input behind it — testing, tracking, medical — is one click deep. Scouts don't trust black boxes, and they shouldn't.
- Similar pro profiles anchor projection.Measurements sit beside comparable NFL players' data, turning "how will he transition?" from a gut call into a comparison.
- Current team → next team. The transition prediction is framed as a trajectory, keeping the scout's real question — pro readiness — on screen at all times.
Validate
Tested, not just presented
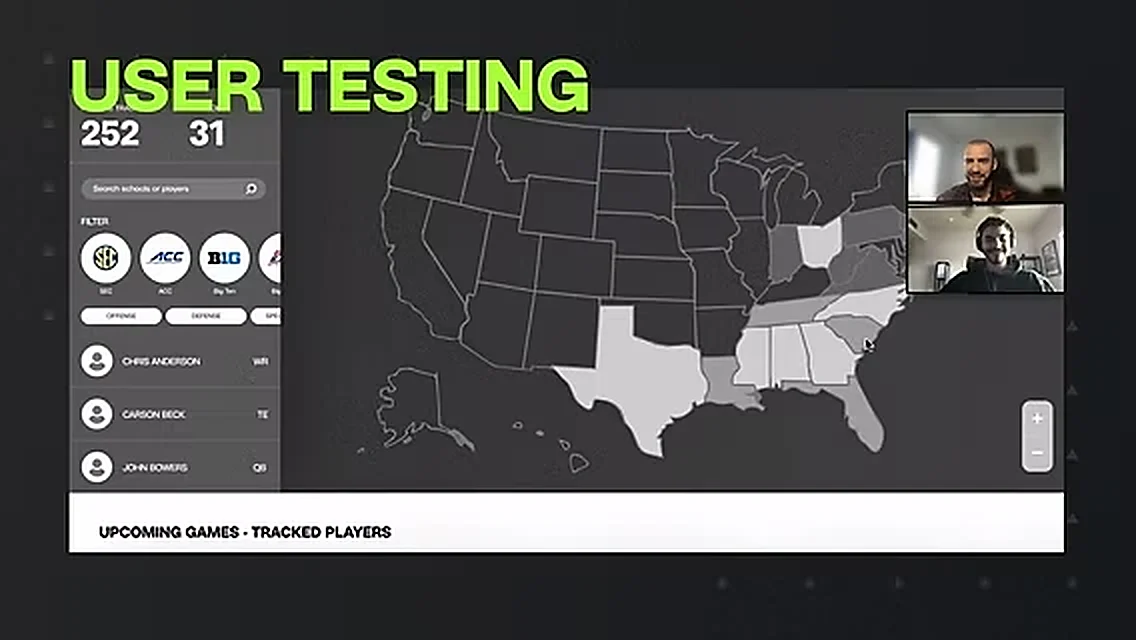
We ran a System Usability Scale questionnaire after each round to measure how usable — and honestly, how enjoyable — the software was, followed by a ten-question interview about the experience of using the prototype. An 85.6 average lands well above the benchmark SUS mean of 68, in the top grade band — strong evidence the density was reading as clarity, not clutter.
Trade-offs
The hard calls
The whole system, not just the dashboard
The safe student move was designing the software and hand-waving the data source. We built the camera on a Raspberry Pi instead — because scouting's real problem is data collection, and a dashboard fed by imaginary data is a poster, not a product.
A single score scouts can argue with
Boiling a prospect down to "75" made some of us uneasy — it invites lazy reads. We kept it, but made every underlying input inspectable. The score starts the conversation; the data underneath is where a scout earns his opinion.
Serving the buyer without betraying the user
Colleges pay for team-development insights; scouts need prospect evaluation. Those pull the interface in different directions. We kept the scout's comparison workflow as the spine and let program analytics live in its own space rather than crowding the profile.
Recognition & reflection
Gold — IDA Design Awards 2024
SCOUT took Gold at the 2024 International Design Awards. The award is nice; the SUS score matters more to me — one is a jury liking the story, the other is fifteen people successfully using the thing.
What I'd validate next
As a concept, SCOUT's open questions are honest ones: how accurate the transition projections prove over real draft classes, whether scouts' trust in the overall grade stays calibrated as they use it, and how the system integrates with the tools NFL front offices already run. A concept earns the right to those questions by being testable — that's why we built hardware.